Analytical
Techniques & Technology.
A comprehensive overview of the spectroscopic methods, computational tools, and connected laboratory systems deployed in our lab, forming the full analytical foundation behind every report we issue.
Raman Spectroscopy
Molecular Fingerprinting
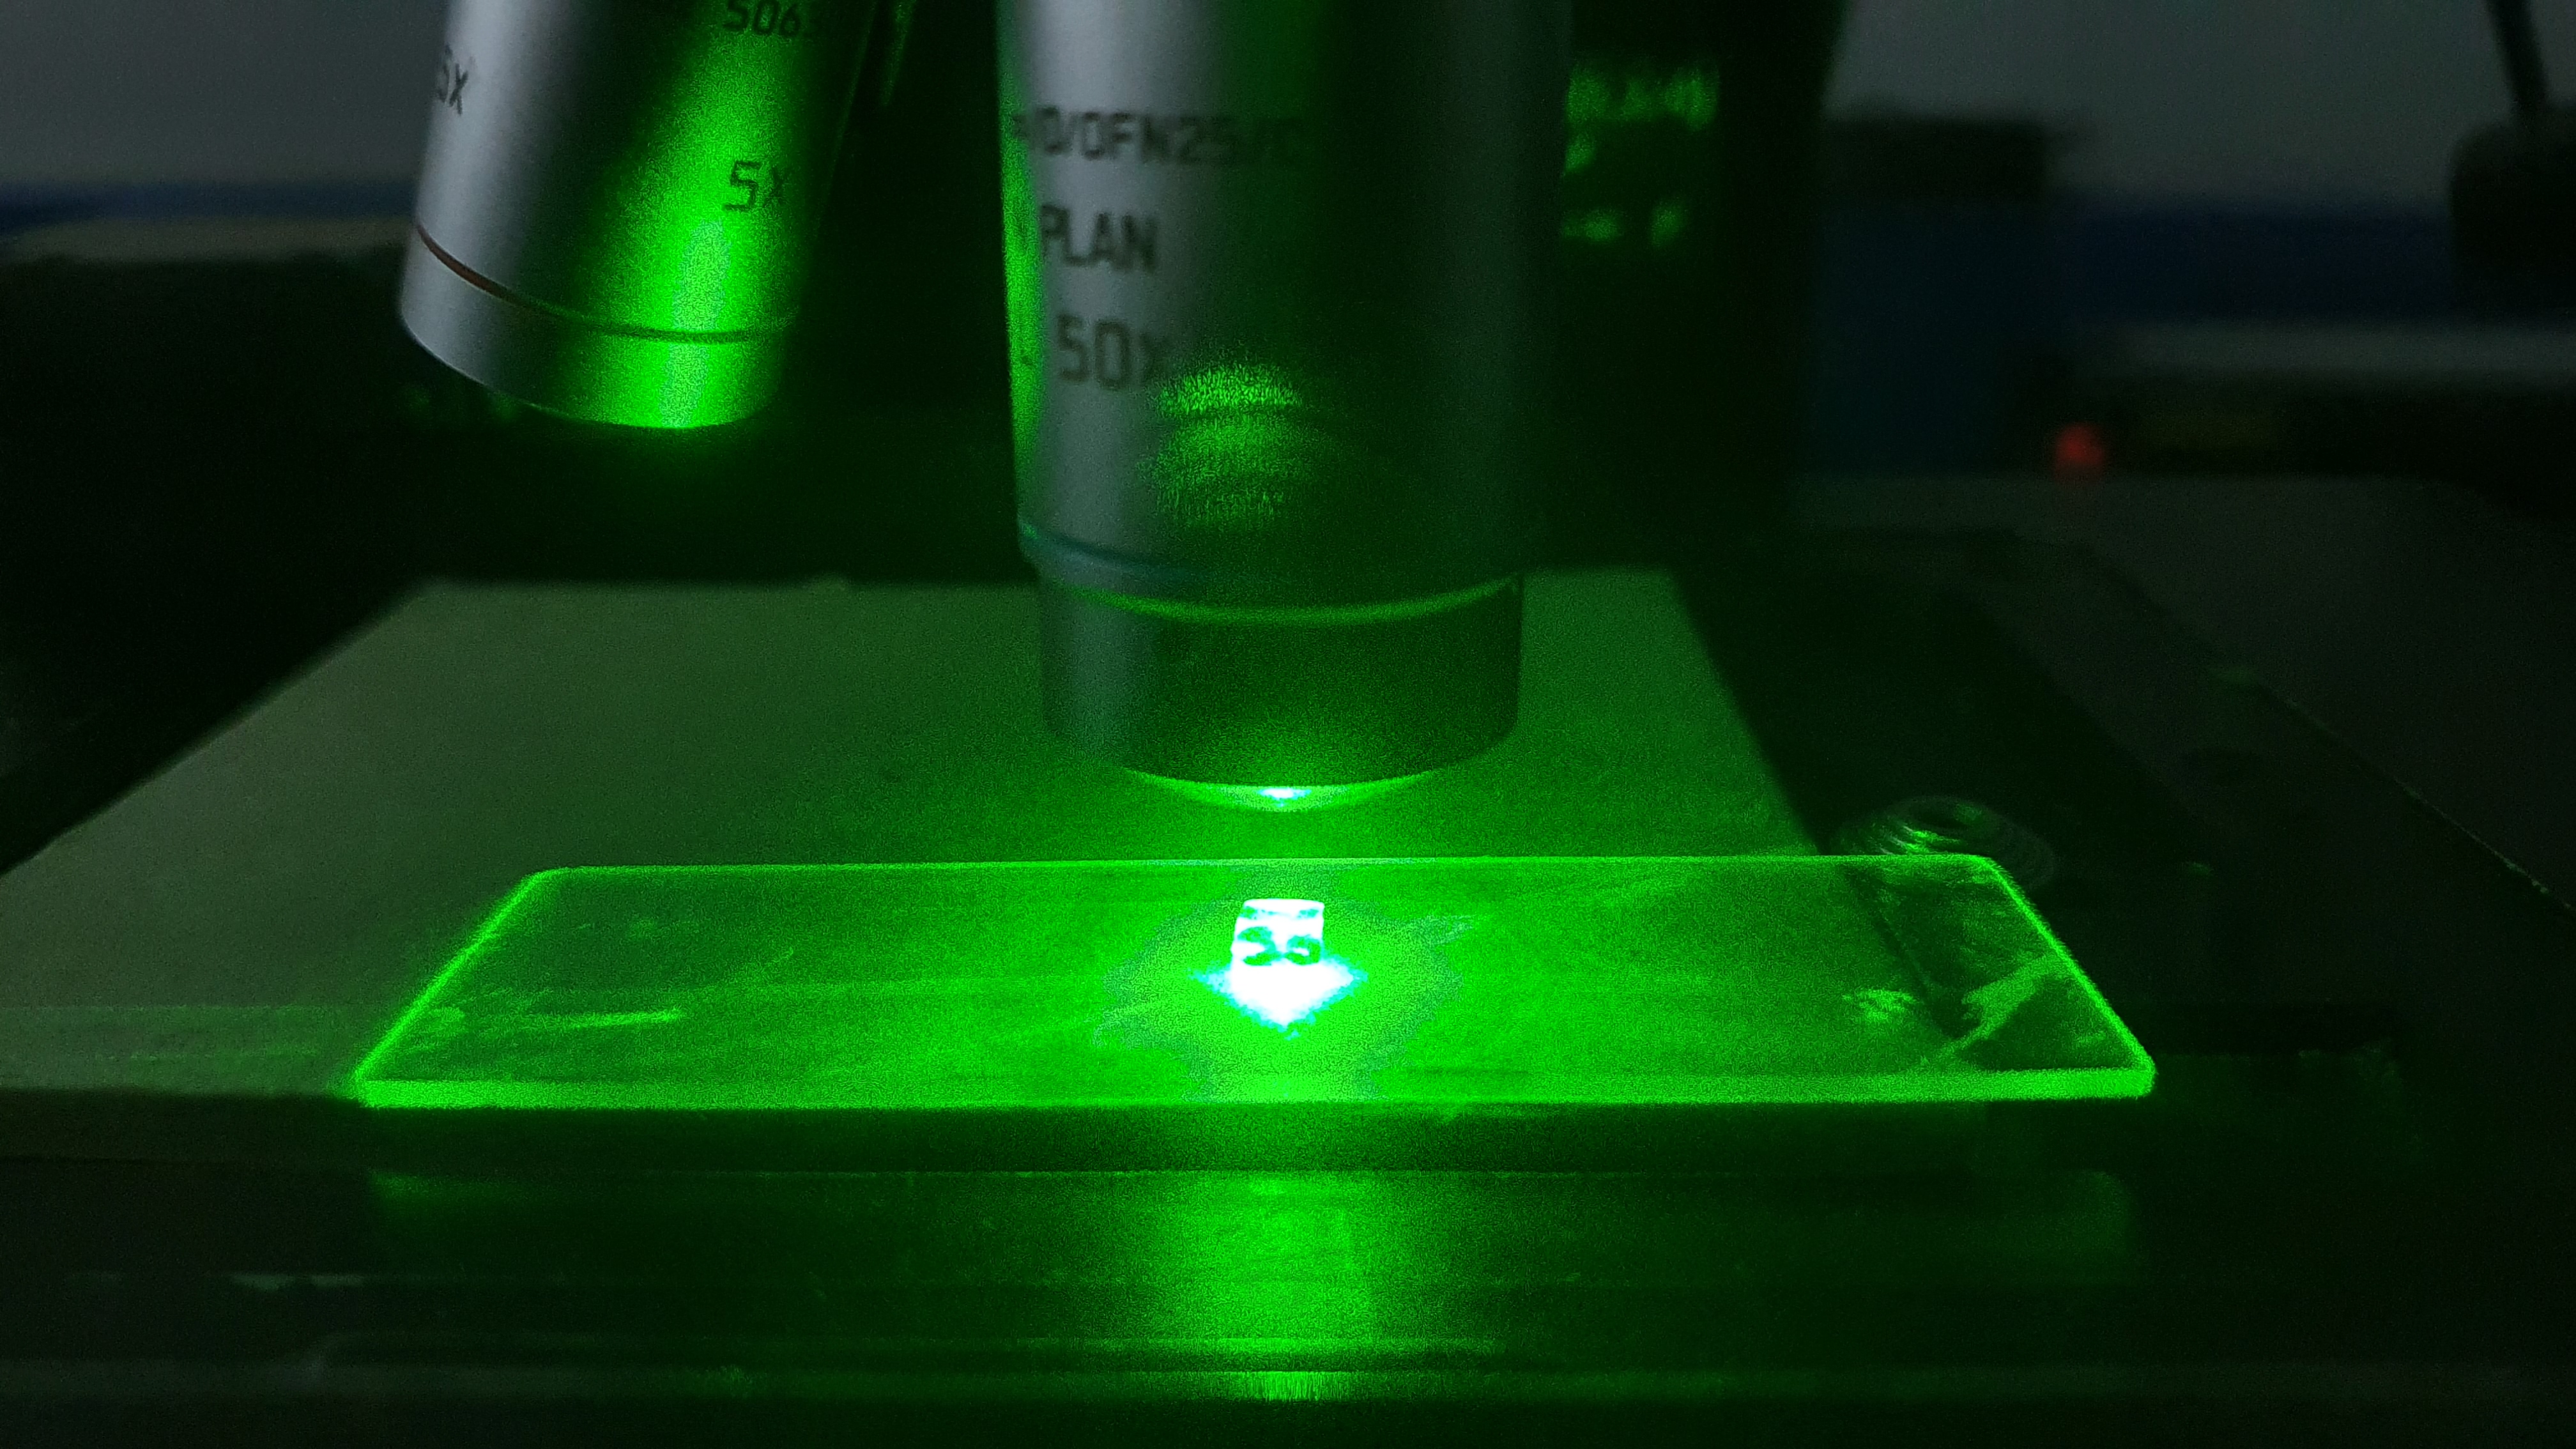
Raman spectroscopy measures the inelastic scattering of monochromatic laser light by a material, producing a unique "fingerprint" spectrum that identifies the molecular composition and crystal structure of a gemstone.
Applications
- • Mineral species identification
- • Inclusion phase determination
- • Synthetic/natural differentiation
- • Filler/treatment material identification
Capabilities
- • Non-destructive, no sample prep
- • Micro-spot analysis (≤1 μm)
- • Reference library: 5,000+ spectra
- • Confocal depth profiling
FTIR Spectroscopy
Infrared Absorption
Fourier-Transform Infrared spectroscopy measures the absorption of infrared radiation by molecular bonds within a gemstone. Critical for detecting treatments and classifying diamond type.
Applications
- • Oil/resin/polymer detection in emerald
- • Diamond type classification (Ia/Ib/IIa/IIb)
- • Heat treatment markers in corundum
- • Water content in opal
Capabilities
- • Transmission and reflectance modes
- • ATR accessory for flat surfaces
- • Mid-IR range: 400–4000 cm⁻¹
- • Quantitative filler classification
UV-Vis-NIR
Absorption Spectroscopy
Measures optical absorption across ultraviolet, visible, and near-infrared wavelengths. Essential for colour cause analysis, chromophore identification, and certain treatment detections.
Applications
- • Colour cause determination
- • Chromophore identification (Cr, Fe, V, Cu)
- • Beryllium diffusion detection
- • Irradiation markers (GR1 centre)
Capabilities
- • 200–1100 nm wavelength range
- • Polarised light measurement
- • Quantitative absorbance data
- • Temperature-dependent spectra
EDXRF
Chemical Composition
Energy Dispersive X-Ray Fluorescence determines the elemental composition of a sample by measuring the characteristic X-rays emitted when the material is excited by an X-ray source.
Applications
- • Trace element profiling for origin
- • Precious metal purity analysis
- • Glass-fill composition detection
- • Coating identification
Capabilities
- • IXRF Atlas Apex with μ-spot optics
- • 5 μm spatial resolution
- • Elements Na to U detectable
- • Non-destructive, no sample prep
Photoluminescence
Defect Centre Analysis
Photoluminescence spectroscopy measures the light emitted by a material when excited by a laser. Critical for identifying defect centres in diamonds and treatment-related optical signatures.
Applications
- • CVD/HPHT diamond identification (SiV, NV)
- • Chromophore centre mapping
- • Time-resolved fluorescence
- • Treatment signature detection
Capabilities
- • Multiple excitation wavelengths
- • Cryogenic temperature capability
- • Spatial mapping mode
- • Sub-nm spectral resolution
From Instrument Signal to Decision Support.
After data capture, our analytical workflow uses machine learning to organise complex multi-instrument evidence into a clearer review path for senior gemmologists.
The purpose is simple: strengthen consistency, highlight relevant patterns, and support final interpretation without replacing expert judgement.
Reference-trained mode compares incoming results against confirmed specimens and known analytical signatures.
Model outputs remain decision-support signals and are reviewed alongside microscopy, spectroscopy, and reference comparison.
How the Lab Turns Raw Data into Reports.
The technology platform sits inside the analytical workflow, linking instrument capture, signal treatment, comparison against references, and structured report assembly.
Acquisition
Microscopy, Raman, FTIR, UV-Vis, EDXRF, and photoluminescence create a structured evidence set for each sample.
Processing
Signals are normalised, compared, tagged, and prepared for consistent review across different techniques and operators.
Correlation
Reference libraries and decision-support models help correlate colour, chemistry, structure, and treatment indicators.
Reporting
Verified conclusions are assembled into the final report with traceable metadata and downstream verification support.
Technology Beyond the Instrument Bench.
The same analytical framework extends into laboratory operations. Sample intake, chain-of-custody, data retention, report verification, and client delivery all sit inside one connected environment so results remain auditable from submission to final issuance.
Laboratory Information Flow
Sample registration, instrument records, and analyst review checkpoints are linked across the full workflow.
Digital Verification
Issued reports can be checked through digital verification tools linked to report identity and status.
Client Access Layer
Portal access supports submission tracking, report retrieval, and clearer communication around testing progress.
Reference Knowledge Base
A growing archive of characterised stones, spectra, and comparative records supports both expert review and future model development.
Which Technique For What?
| Question | Primary Technique | Supporting Technique |
|---|---|---|
| What is this mineral? | Raman | EDXRF |
| Where is it from? | EDXRF | UV-Vis, Microscopy |
| Has it been heated? | Microscopy | FTIR, UV-Vis |
| Is the emerald oiled? | FTIR | UV fluorescence |
| Natural or lab-grown diamond? | PL + FTIR | UV-Vis |
| What metal purity? | EDXRF | — |
| What causes the colour? | UV-Vis | PL, EDXRF |
Science, Systems, and Every Report.
Every conclusion we issue is supported by instrument data, structured interpretation, and a traceable analytical workflow.
Submit for Testing